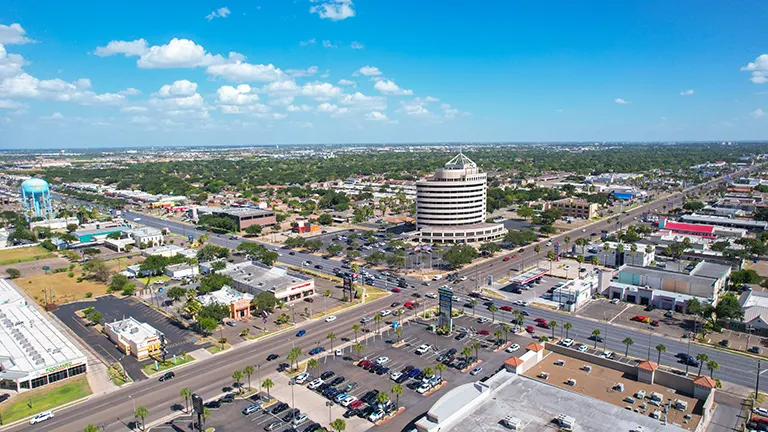
When people outside South Texas evaluate our region, they often look at individual cities.
Roma. Rio Grande City. Mission. McAllen. Edinburg. Pharr. Weslaco. Harlingen. Raymondville. Brownsville.
They look at each city's population, economic activity, and growth, then compare those numbers against larger cities throughout Texas.
But I believe that approach misses something important about the Rio Grande Valley.
We're not just a collection of individual cities. We're one connected regional economy.
Think about the Dallas–Fort Worth Metroplex.
Someone might live in Plano and work in Dallas. Another person might live in Arlington and work in Fort Worth. They shop, eat, and spend their weekends in different communities.
Our region operates much the same way.
Someone can live in McAllen and work in Edinburg. Live in Weslaco and work in McAllen. Live in Mission and shop in Pharr. Or live in Harlingen and spend the weekend in South Padre Island.
For many of our neighboring communities, the drive between cities is relatively short. We cross city boundaries every day without giving it much thought.
Our jobs, shopping centers, restaurants, universities, hospitals, and entertainment destinations serve people from throughout the region.
Of course, we're not the same size as Dallas–Fort Worth. But the concept is no different.
We live in individual cities, but we participate in a regional economy.
And when we look at the data across all four Rio Grande Valley counties, the numbers tell a much bigger story.
44 Cities. $361 Million in Sales Tax Allocations.
Here's a number that deserves more attention.
$361.1 million.
That's how much the 44 cities across Hidalgo, Cameron, Starr, and Willacy counties received in combined city sales tax allocations from January through October 2026.
That's a 5.9% increase, or approximately $20.1 million more than the same period in 2025.
Even more encouraging, 39 of the 44 cities recorded higher allocations than the previous year.
And that's just the city sales tax allocation figure. It doesn't include county, transit, or special district allocations.
Now consider another number.
During the second quarter of 2026 alone, our four counties generated approximately $4.29 billion in taxable sales.
That's in just three months.
Hidalgo County accounted for approximately $2.81 billion, followed by Cameron County at $1.29 billion, Starr County at $169.8 million, and Willacy County at $21.6 million.
At the state's 6.25% sales tax rate, that quarterly taxable sales base represents approximately $268 million in state sales and use tax.
And these figures don't capture every type of economic activity taking place throughout South Texas.
Think about that for a moment.
Billions of dollars in taxable transactions every quarter, across a region that is often evaluated one city at a time.
That's a much larger marketplace than individual city statistics might suggest.
Growth Is Happening Across All Four Counties
One of the most encouraging findings from our research is that every county recorded an increase in its combined city sales tax allocations during the first ten months of 2026.
| County | Jan–Oct 2026 Allocations | Growth |
|---|---|---|
| Hidalgo | $241.7 million | +5.7% |
| Cameron | $109.3 million | +5.8% |
| Starr | $8.0 million | +10.4% |
| Willacy | $2.0 million | +16.9% |
Hidalgo and Cameron counties generate most of the region's sales tax revenue, but Starr and Willacy counties recorded the highest percentage increases.
That's worth paying attention to.
We naturally hear more about development and investment in our largest cities, but there are opportunities emerging throughout the Valley.
Look at some of the cities posting the strongest year-over-year increases in sales tax allocations:
- Port Isabel: +23.9%
- Raymondville: +16.4%
- Los Fresnos: +12.7%
- Rio Grande City: +12.2%
- La Feria: +11.5%
- Donna: +10.9%
- Hidalgo: +10.5%
- San Juan: +10.3%
These are cities that received at least $1.5 million in allocations during the reporting period.
Among smaller communities, La Grulla increased 119.4%, Sullivan City 29.7%, Primera 25.7%, and Lyford 20.3%.
Now, percentage growth doesn't always tell the full story. A smaller community can experience a significant percentage increase from a relatively modest dollar change.
But I still believe these communities deserve recognition.
Raymondville, Rio Grande City, Port Isabel, and others are contributing to the region's economic momentum.
And as infrastructure improves, businesses expand, and new developments come online, I believe we'll continue seeing opportunities beyond our traditional commercial centers.
Our Largest Cities Remain Important Economic Drivers
While smaller communities are showing strong percentage growth, our larger cities continue to generate substantial economic activity.
From January through October 2026:
| City | Sales Tax Allocations | Growth |
|---|---|---|
| McAllen | $89.9 million | +8.1% |
| Brownsville | $54.7 million | +4.7% |
| Edinburg | $35.4 million | −2.1% |
| Harlingen | $31.4 million | +3.7% |
| Pharr | $27.7 million | +6.8% |
| Mission | $25.4 million | +4.9% |
| Weslaco | $18.6 million | +4.6% |
McAllen continues to stand out as a major retail destination.
In fact, its $89.9 million in city sales tax allocations represents approximately $597 per resident, using the city's July 2025 population estimate.
For comparison, Brownsville generated approximately $283 per resident, and Mission generated $286.
Why is that important?
Because McAllen's retail economy serves far more people than those who live within its city limits.
Customers travel from surrounding communities and Mexico to shop, dine, receive services, and conduct business.
The same principle applies to other commercial centers throughout the Valley.
A city's population doesn't necessarily represent the size of the market its businesses serve.
And for anyone evaluating retail locations or commercial real estate investments, that's an important distinction.
Sales Tax Revenue Helps Build Communities
There's another side to this story that I believe deserves attention.
Sales tax revenue doesn't just reflect business activity. It also helps fund the communities where that activity takes place.
In many Rio Grande Valley cities, the combined state and local sales tax rate is 8.25%.
On a taxable $100 purchase, $6.25 represents the state portion, while up to $2.00 represents local sales taxes.
Depending on the city, part of that local revenue may support an economic development corporation.
These organizations can help fund eligible infrastructure improvements, workforce development, business recruitment, and community projects.
For example, McAllen dedicates a half-cent sales tax to its Development Corporation, while Brownsville divides a half-cent between its economic development and community improvement corporations.
These funds can support projects that improve accessibility, attract businesses, create employment opportunities, and improve quality of life.
And those improvements can encourage additional private investment.
That's what makes economic development so important. The impact of one business or one project can extend throughout the surrounding community.
What Does This Mean for Commercial Real Estate?
As someone who works in commercial real estate throughout South Texas, this is where I see tremendous opportunity.
When evaluating a property or development site, we look beyond the population of the city where it's located.
We study the surrounding trade area, traffic patterns, consumer spending, employment centers, infrastructure, and future development.
A retail center in Pharr may serve customers from McAllen, San Juan, and Edinburg.
An industrial facility in Harlingen may serve businesses throughout Cameron and Willacy counties.
A development in Rio Grande City may attract customers from surrounding Starr County communities.
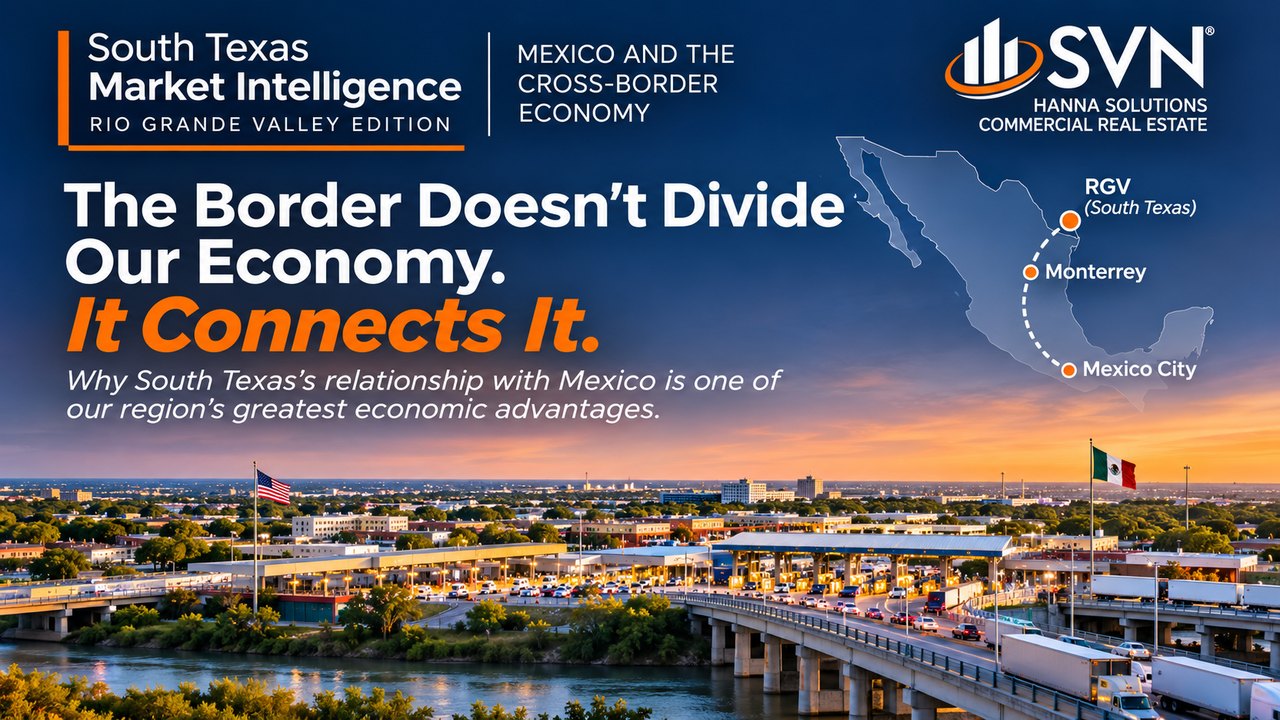
And a hospitality or retail investment in Brownsville may benefit from activity throughout the lower Valley and Northern Mexico.
These regional relationships matter when determining whether a location can support a new business, shopping center, industrial development, or investment property.
They also help explain why certain commercial corridors perform differently from what their immediate population numbers might suggest.
For investors and developers unfamiliar with South Texas, understanding how our communities interact can reveal opportunities that might otherwise be overlooked.
We Need to Tell Our Regional Story Better
I believe South Texas has an incredible opportunity to change how the rest of Texas and the country view our region.
But we have to tell our story with data.
We can't expect an investor in Dallas, Houston, Austin, or another part of the country to understand the Rio Grande Valley the same way those of us who live and work here do.
When they see 44 cities, four counties, billions of dollars in quarterly taxable sales, and more than $361 million in combined city sales tax allocations over ten months, the conversation changes.
And when you add our international trade infrastructure, proximity to Mexico, universities, workforce, and continued private investment, the opportunity becomes even more compelling.
Our communities have their own identities, leadership, and economic development priorities. That's part of what makes the Rio Grande Valley special.
But we also share a common economic future.
I believe there's tremendous value in working together, promoting our strengths, and helping others understand what our region has to offer.
Because the more attention and investment we attract to South Texas, the more opportunities we can create for businesses, families, and future generations.
The Rio Grande Valley isn't just McAllen, Brownsville, Edinburg, or any one city.
It's all of us. And together, we're a much bigger economic force than many people realize.
Our best years are still ahead of us.
Download the Research Report
For our third edition of South Texas Market Intelligence, we've prepared a ten-page research report:
Sales Tax at Work: From Register to Community
The report includes regional sales tax figures, county and city growth comparisons, maps showing where economic activity is concentrated, and an overview of how local sales tax revenue supports economic development.
The research is based on publicly available information from the Texas Comptroller of Public Accounts, U.S. Census Bureau, and local government sources.
Download the November 2026 South Texas Market Intelligence Report — Edition 03
Our goal with this series is to organize publicly available information, share useful market insights, and help investors, business owners, and community leaders better understand the opportunities throughout South Texas.
Mark Hanna, CCIM
SVN | Hanna Solutions Commercial Real Estate
Office: (956) 322-4001
Mark.Hanna@svn.com